Why Production Drifts Quietly: Assessments, Maturity Models, and Roadmaps
Introduction
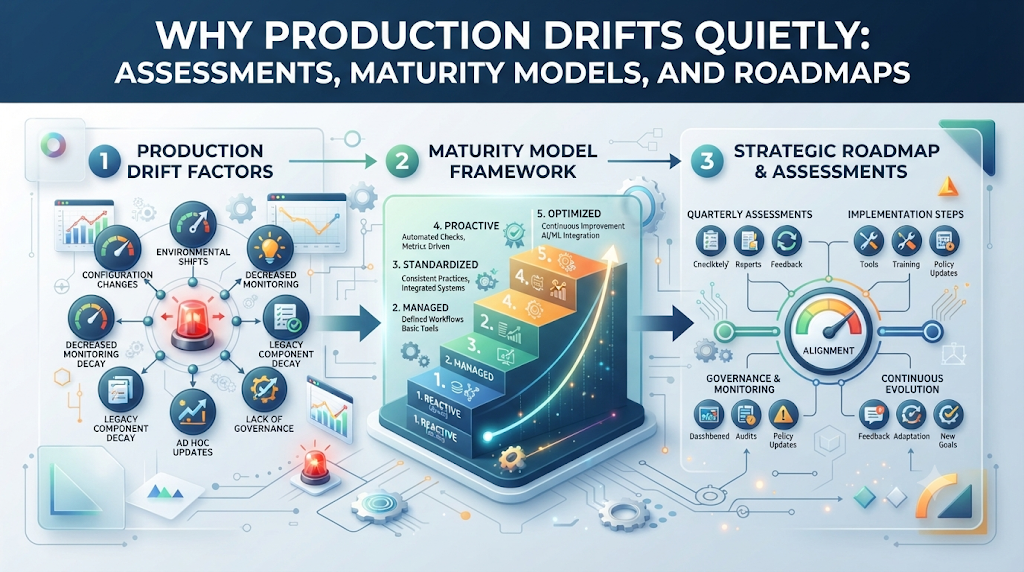
Shipping a new build feels straightforward until a checkout queue backs up during a sale, a shared cache node runs out of memory, or a cloud invoice arrives far above budget.Most engineering teams already have strong developers and capable cloud tools. Friction builds when day-to-day operational habits lag behind product releases. Pipelines accumulate manual workarounds, alert channels fill up with noise engineers mute, and nobody has a clear map of which services are brittle.OpsRoadmaps addresses that drift as an engineering operations assessment and improvement platform. Rather than offering individual coding courses or standalone study paths, it pairs team-level assessments, transparent maturity scoring, practical reference guides, and sequenced roadmaps so technical leaders can see where operations stand today and plan fixes in a practical order.opsroadmaps.com
Understanding Engineering Operations Maturity
Operational maturity shows up when something breaks. Low-maturity groups lean on late-night heroics, institutional memory, and reactive firefighting. High-maturity teams rely on repeatable automation, explicit service ownership, and tight feedback loops so routine faults get absorbed quietly.
Ten connected capabilities shape how well an organization runs software in production:
- Software delivery practices: Building, testing, and shipping code changes automatically without manual bottlenecks.
- Infrastructure automation: Managing servers, networks, and storage through version-controlled code rather than manual console edits.
- Reliability engineering: Setting concrete availability targets and designing services to survive partial component failures.
- Security integration: Running vulnerability scans, secret checks, and policy guardrails automatically inside daily workflows.
- Incident response: Catching degradations early, running structured triage, and holding blameless postmortems afterward.
- Observability: Connecting metrics, logs, and traces so engineers can debug unfamiliar bugs across distributed services.
- Cloud operations: Keeping multi-environment infrastructure consistent, resilient, and recoverable across availability zones or regions.
- Platform engineering: Building self-service internal tools that hide infrastructure complexity behind clean developer workflows.
- Cost management: Linking cloud spend directly to teams and workloads so waste gets spotted before monthly invoices spike.
- Continuous improvement: Turning post-incident findings and operational metrics into scheduled engineering work.
Evaluating these areas systematically replaces guesswork with evidence. Engineering leaders and practitioners can spot weak links early, agree on priorities, and spend limited engineering hours where they reduce the most risk.
What Is a Production Readiness Assessment?
A production readiness assessment is a pre-launch engineering check designed to answer one practical question: Can this service survive real traffic and real failures without waking up the entire team? Teams run it before launching new applications, migrating stateful data, or rolling out major architectural changes.
A useful readiness review examines ten operational areas:
- Application reliability: Sensible timeouts, bounded retries, circuit breakers, and graceful degradation when dependencies stall.
- Infrastructure readiness: Multi-zone redundancy, tested failover paths, and clean network routing.
- Security controls: Least-privilege access permissions, encryption in transit and at rest, and hardened runtime defaults.
- Monitoring and alerting: Alerts tied to user-facing symptoms rather than noisy CPU spikes, paired with clear service dashboards.
- Backup and recovery: Automated snapshots, explicit recovery objectives, and verified restore drills—not untested assumptions.
- Deployment procedures: Repeatable rollout pipelines, canary or blue-green options, and fast, rehearsed rollback steps.
- Incident response: Active on-call schedules, clear escalation paths, and initial triage runbooks for known failure modes.
- Performance testing: Load test data proving the service handles peak traffic without exhausting memory or connection pools.
- Capacity planning: Realistic resource headroom and autoscaling rules calibrated to actual workload behavior.
- Operational documentation: Current dependency maps, architecture notes, and named team ownership.
Finding an unverified backup restore or a broken rollback script during a readiness review takes a few hours to fix; discovering it during an outage costs customers and trust. Still, an internal assessment only evaluates the answers and evidence a team provides—it is an engineering safeguard, not a replacement for an independent third-party audit or formal compliance certification.
DevOps Maturity Assessment: Evaluating Software Delivery Practices
Buying modern CI/CD tools does not guarantee fast or safe software releases. A DevOps maturity assessment looks past the tool stack to measure how reliably code moves from a developer’s branch into production—and how painlessly teams recover when a deployment goes wrong.
Reviews generally examine ten delivery habits:
- Continuous integration and delivery (CI/CD): Automated builds and verification checks running on every commit without manual handoffs.
- Infrastructure as Code (IaC): Declarative environment definitions that keep staging and production aligned.
- Version control practices: Short-lived branches, required peer reviews, and protected main branches.
- Automated testing: Fast unit, integration, and contract tests catching regressions before code reaches production.
- Deployment frequency: How routinely teams ship small, low-risk changes instead of bundling risky mega-releases.
- Release management: Separating code deployment from feature activation through feature flags and progressive rollouts.
- Team collaboration: Shared accountability for production health across developers and operations engineers.
- Monitoring and feedback: Immediate post-release telemetry showing error rates and latency right after a deploy.
- Change management: Automated risk checks and audit logs replacing slow weekly change approval boards.
- Automation practices: Eliminating fragile manual scripts across environment provisioning, artifact signing, and promotion.
| Maturity Stage | Typical Delivery Behavior | Common Bottlenecks |
|---|---|---|
| Ad Hoc | Manual builds, infrequent weekend releases, stressful rollbacks | Brittle shell scripts, manual QA queues, siloed handoffs |
| Repeatable | Basic CI builds, scripted deployments, dedicated staging servers | Configuration drift, slow manual release sign-offs |
| Automated | Full CI/CD pipelines, Infrastructure as Code, automated rollbacks | Flaky integration tests, tightly coupled services |
| Optimized | Feature flags, canary rollouts, automated post-deploy verification | Complex multi-region orchestration and state migrations |
Assessment findings help teams stop guessing why delivery feels sluggish. Instead of buying another tool, an engineering manager might see that flaky integration tests and manual environment approvals are the real bottlenecks holding back releases.
Kubernetes Production Readiness Checklist
Kubernetes offers tremendous flexibility for containerized workloads, yet its out-of-the-box defaults are built for quick experimentation rather than production resilience. Launching workloads without hardening cluster and pod configurations often leads to noisy-neighbor memory crashes, exposed internal endpoints, or downtime during routine node maintenance.
A thorough Kubernetes production readiness checklist forces teams to verify critical safeguards before workloads go live:
- Cluster architecture: Control planes and worker nodes spread across availability zones, strict separation between production and non-production clusters, and a tested upgrade strategy.
- Resource requests and limits: Accurate CPU and memory requests for scheduling, paired with memory limits so one leaking container cannot starve an entire node.
- Readiness and liveness probes: Readiness probes keeping traffic away from uninitialized pods, and liveness probes tuned carefully so slow startups do not trigger endless restart loops.
- Container image security: Minimal base images, pinned immutable image digests, non-root execution, and automated image vulnerability scanning.
- Network policies: Default-deny ingress and egress policies limiting pod-to-pod traffic strictly to explicit dependencies.
- Secrets management: Encrypted cluster storage or external secret managers injecting credentials at runtime rather than committing plaintext keys to Git.
- Persistent storage: Validated storage classes, explicit reclaim policies, and scheduled volume snapshots for stateful services.
- Autoscaling: Horizontal pod autoscalers tied to meaningful load metrics alongside cluster autoscalers configured for realistic node startup times.
- Monitoring and logging: Centralized log aggregation, container metrics scraping, and alerts for crash-looping or unschedulable pods.
- Backup and recovery: Scheduled backups of cluster manifests, custom resources, and persistent volumes with tested restoration steps.
- Deployment strategies: Rolling update settings (
maxUnavailable,maxSurge) combined with pod disruption budgets so node drains never take down every replica simultaneously. - Disaster recovery planning: Documented procedures for rebuilding clusters, shifting DNS, and failing over stateful data.
Walking through these checks catches the most frequent Kubernetes misconfigurations early. Even so, a checklist only verifies readiness at a single moment; keeping a cluster secure and reliable requires ongoing patching, version upgrades, and active runtime monitoring.
Platform Engineering Adoption Roadmap
When every product squad has to master Terraform, Kubernetes manifests, access roles, and CI pipelines from scratch, feature delivery slows down. Platform engineering addresses that friction by treating internal infrastructure like a product—building an internal developer platform that offers self-service “golden paths” with reliability and security built in.
A practical platform engineering adoption roadmap moves through ten clear stages:
- Understand developer needs: Talk directly with application engineers to learn where they lose the most time—provisioning databases, debugging pipelines, or requesting permissions.
- Evaluate existing engineering workflows: Map how a code change moves from commit to production and mark every manual handoff or ticket queue.
- Identify repeated operational tasks: Audit recent infrastructure support tickets to spot repetitive requests worth automating.
- Define platform goals: Set measurable targets—such as cutting new service bootstrap time from two weeks to under an hour—rather than vague platform slogans.
- Design the platform architecture: Select modular control planes, APIs, and portal interfaces that fit naturally into existing cloud and CI tooling.
- Build reusable infrastructure capabilities: Package common infrastructure patterns into maintained infrastructure modules, deployment charts, and pipeline templates with safe defaults.
- Introduce self-service workflows: Let developers spin up compliant environments and services through a portal or command-line tool without waiting on operations tickets.
- Integrate security and governance: Embed policy-as-code guardrails, automated secret injection, and least-privilege roles directly into platform templates.
- Measure adoption and developer experience: Track voluntary golden-path adoption, provisioning speed, and places where engineers still bypass the platform.
- Improve the platform continuously: Collect regular user feedback and refine templates based on real operational friction.
Teams often stumble when they spend a year building a massive platform in isolation before asking developers what they actually need. Rolling out capabilities incrementally—starting with the single biggest workflow bottleneck—builds credibility and earns organic adoption.
SRE Adoption Roadmap: Building Reliable Software Systems
Site Reliability Engineering (SRE) applies software engineering discipline to operations problems. Rather than chasing an unrealistic target of zero failures, SRE gives product and engineering teams a shared quantitative framework for balancing feature velocity against system stability.
Core SRE practices include:
- Service Level Indicators (SLIs): Direct measurements of user experience, such as successful HTTP request ratios or 99th-percentile response latency.
- Service Level Objectives (SLOs): Explicit reliability targets over a rolling window—for example, 99.9% availability over 30 days.
- Error budgets: The permissible failure margin (
100% - SLO). When budget remains, teams ship features normally; when it runs low, reliability work takes priority. - Reliability reviews: Architecture and operational checkups for business-critical services.
- Incident response: Defined command roles and clear communication protocols during live outages.
- Automation: Writing software to replace repetitive manual maintenance and recovery procedures.
- Capacity planning: Modeling organic growth and load-testing services ahead of traffic spikes.
- Toil reduction: Tracking and eliminating manual, repetitive operational tasks that scale linearly with service growth.
- Post-incident learning: Blameless postmortems focused on fixing systemic weaknesses rather than faulting individuals.
- Continuous improvement: Reviewing SLO performance regularly and ensuring postmortem follow-up tasks ship.
An illustrative SRE adoption roadmap starts small rather than reorganizing the entire engineering department overnight. Pick one or two critical customer-facing services, instrument basic latency and error SLIs, and agree on realistic SLOs with product stakeholders. Define a clear error-budget policy so everyone understands what happens when reliability dips. Once those habits take hold, expand SLO coverage to core dependencies, track operational toil each sprint, and automate high-frequency runbooks.
Simply renaming an operations team “SRE” changes nothing; lasting progress requires shared ownership between product and engineering, measurable reliability goals, and protected time to pay down operational debt.
Incident Management Maturity Model
Every production system experiences outages eventually. An incident management maturity model measures how calmly, rapidly, and consistently an organization detects disruptions, restores service, and prevents repeat failures.
Maturity spans ten operational areas:
- Incident detection: Automated alerts triggered by real user symptoms before customers open support tickets.
- Alert quality: High-signal pages paired with clear severity levels and direct links to triage runbooks.
- Incident classification: Shared severity tiers (such as SEV-1 through SEV-4) tied to customer and business impact.
- Escalation procedures: Reliable paging schedules and automatic fallbacks when alerts go unacknowledged.
- On-call responsibilities: Sustainable rotation schedules, clean shift handoffs, and reasonable alert loads that prevent responder burnout.
- Communication: Dedicated incident channels, an assigned incident commander, and timely updates for stakeholders and status pages.
- Root cause analysis: Looking beyond immediate triggers to uncover deeper code, configuration, or dependency flaws.
- Post-incident reviews: Structured postmortem discussions held shortly after recovery while details are fresh.
- Corrective actions: Prioritized, tracked engineering tickets addressing the root causes and detection gaps found during review.
- Incident trend analysis: Reviewing incident patterns across quarters to spot recurring failure themes across teams.
| Maturity Stage | Outage Response | Post-Incident Learning |
|---|---|---|
| Reactive | Customers report outages first; engineers troubleshoot in ad hoc chats | Informal debriefs; fixes rarely make it into sprints |
| Defined | Basic monitoring alerts fire; on-call rotations exist on paper | Postmortems happen only after major, visible outages |
| Managed | Symptom alerts, clear incident commanders, regular status updates | Consistent blameless reviews with tracked remediation tickets |
| Continuously Improving | Automated anomaly detection and scheduled failure drills | Cross-team trend analysis driving systemic architectural fixes |
Blameless culture is the foundation of mature incident management. When engineers know they will not be blamed for honest mistakes, they surface hidden system fragilities openly—allowing teams to harden tooling and guardrails instead of hoping people never make errors.
DevSecOps Implementation Roadmap
Treating security as a final pre-launch gate creates predictable friction: either releases stall for weeks while teams scramble to remediate findings, or security checks get bypassed under deadline pressure. DevSecOps weaves automated security controls directly into daily coding and delivery workflows so risks are caught while changes are small and cheap to fix.
Comprehensive DevSecOps programs address ten operational areas:
- Secure coding practices: Practical developer guidance covering input validation, authentication, and safe API design.
- Code security analysis: Static application security testing scanning pull requests for common vulnerability patterns.
- Dependency scanning: Software composition analysis flagging known vulnerabilities and license risks in third-party packages.
- Container security: Scanning container images for vulnerable OS packages and blocking unverified images at deployment.
- Infrastructure security: Checking infrastructure-as-code templates for open storage buckets, overly permissive firewalls, or unencrypted volumes.
- Secrets management: Blocking accidental credential commits and pulling dynamic secrets from managed vaults at runtime.
- Compliance automation: Encoding security baselines into automated pipeline checks with clear audit trails.
- CI/CD security controls: Hardening build runners, signing release artifacts, and restricting pipeline permissions.
- Vulnerability management: Prioritizing remediation by actual exploitability and exposure rather than treating every low-severity warning identically.
- Security monitoring: Runtime anomaly detection and centralized audit logging across cloud accounts and clusters.
A realistic DevSecOps implementation roadmap introduces controls across five phases:
- Baseline visibility: Enable repository secret scanning and dependency vulnerability alerts in monitor-only mode so teams see existing exposure without breaking builds overnight.
- Pull-request guardrails: Add fast code and infrastructure-as-code checks to pull requests, blocking merges only on high-confidence critical issues.
- Artifact and container gates: Require automated image scanning in registries and enforce admission policies so unsigned or critically vulnerable images cannot reach production.
- Centralized secret rotation: Replace static environment variables with managed secret stores and automated credential rotation.
- Runtime defense and governance: Layer on runtime threat detection and automated compliance checks, routing findings into regular engineering triage.
Automated scanners scale effortlessly across hundreds of repositories, yet tools do not replace security expertise. Security engineers remain vital for threat modeling new architectures, evaluating nuanced business risks, and guiding complex compliance requirements.
Observability Maturity Model: Improving Operational Visibility
Traditional monitoring tells you when a known threshold crosses a red line; observability lets you investigate unexpected behavior in production without shipping new debug code. In distributed architectures where a single user action crosses dozens of microservices, basic uptime checks leave engineers guessing during incidents.
Modern observability rests on correlating three core telemetry signals:
- Metrics: Compact numeric measurements over time—like request rates, error ratios, and queue depth—suited for fast dashboards and alerts.
- Logs: Structured, timestamped event records capturing detailed error context and execution traces.
- Traces: End-to-end timelines tracking a single request across API gateways, microservices, caches, and databases.
An observability maturity model helps teams evaluate how effectively they turn telemetry into fast troubleshooting across eight capabilities:
- Distributed tracing: Propagating trace context headers across service boundaries and message queues.
- Application performance monitoring (APM): Pinpointing slow database queries, lock contention, and external API bottlenecks.
- Alert management: Routing pages based on SLO burn rates and customer impact rather than noisy host thresholds.
- Service dashboards: Standardized dashboards showing latency, traffic, errors, and saturation for every production service.
- Telemetry collection: Using open instrumentation standards so telemetry stays portable across backends.
- Dependency visibility: Live service topology maps showing upstream and downstream runtime relationships.
- Service health monitoring: Synthetic probes and real-user monitoring measuring actual end-to-end experience.
- Troubleshooting workflows: Seamless pivoting from an alert spike directly to correlated traces and filtered error logs.
| Maturity Stage | Telemetry Setup | Troubleshooting Reality |
|---|---|---|
| Basic Monitoring | Host CPU/disk metrics and scattered plain-text logs | SSHing into servers, grepping files manually, slow guesswork |
| Centralized Telemetry | Aggregated log search and basic per-service dashboards | Faster log queries, but manual correlation across tools |
| Correlated Observability | Structured logs, golden-signal dashboards, and distributed traces | Jumping straight from an error spike to the exact failing service hop |
| SLO-Driven Operations | Open instrumentation standards, burn-rate alerts, high-cardinality slicing | Proactive bottleneck detection and rapid, low-stress triage |
Collecting terabytes of unindexed logs does not automatically produce observability. Without consistent service labels, propagated trace IDs, and clean dashboards, extra telemetry simply inflates storage costs while slowing down incident response.
Cloud Cost Optimization Roadmap
Cloud elasticity makes scaling effortless, which is also why cloud spending drifts upward so easily. When engineers can provision clusters, databases, and cross-region pipelines via API in seconds, waste accumulates quietly unless financial accountability is built into everyday engineering workflows.
Eight common patterns drive unnecessary cloud spend:
- Oversized infrastructure: Virtual machines, nodes, and database instances running at low utilization around the clock.
- Idle resources: Detached storage volumes, unused load balancers, orphaned static IPs, and forgotten test clusters.
- Unused storage: Years of unpruned snapshots and cold logs sitting in expensive high-performance storage tiers.
- Inefficient workloads: Unoptimized database queries or memory leaks forcing autoscalers to spin up extra nodes.
- Poor resource allocation: Missing container resource requests or running fault-tolerant batch jobs on full-price on-demand instances instead of spot capacity.
- Unmonitored data transfer: Chatty services passing heavy payloads across availability zones or regions.
- Unnecessary environments: Dev, QA, and staging environments running full-scale databases overnight and across weekends.
- Lack of cost ownership: Untagged shared cloud accounts where no team sees the bill for the resources they deploy.
A structured cloud cost optimization roadmap aligns spending with real workload demand in ten steps:
- Establish spending visibility: Enforce mandatory resource tags (owner, service, environment) and centralize billing data.
- Identify major cost drivers: Rank monthly spend by service, account, and region to tackle the biggest line items first.
- Review resource utilization: Analyze historical CPU, memory, disk IOPS, and network usage across compute and database fleets.
- Clean up idle and unused resources: Remove unattached volumes, stale snapshots, and inactive load balancers.
- Evaluate workload patterns: Separate steady-state baseline services from bursty or interruptible batch jobs.
- Right-size and schedule capacity: Downsize over-provisioned instances, shut down non-production environments off-hours, and apply savings plans or reserved capacity to predictable baselines.
- Set budgets and anomaly alerts: Trigger automated notifications when daily spend jumps unexpectedly.
- Track unit cost trends: Measure infrastructure cost per customer transaction or active user alongside raw monthly totals.
- Bring cost into architecture reviews: Weigh storage tiers and data-transfer topology before launching high-volume pipelines.
- Schedule recurring reviews: Revisit utilization and commitments quarterly so savings hold as systems evolve.
Thoughtful cost optimization never sacrifices reliability or security just to shrink a monthly bill; trimming capacity so aggressively that traffic surges cause outages ends up costing far more than the infrastructure saved.
Kubernetes CrashLoopBackOff Troubleshooting
Seeing CrashLoopBackOff in kubectl get pods means Kubernetes is caught in a restart cycle: a container starts, exits with a non-zero code, and the node agent restarts it after an increasingly long delay—starting at 10 seconds and backing off up to 5 minutes per attempt. CrashLoopBackOff is the symptom, not the underlying bug.
Ten common issues cause containers to exit repeatedly:
- Application startup errors: Unhandled exceptions, missing runtime packages, or syntax errors crashing the process immediately.
- Incorrect container commands: Typos in the image entrypoint or overridden pod command and arguments.
- Missing environment variables: Required configuration keys omitted from deployment manifests or config maps.
- Invalid configuration: Malformed JSON, YAML, or properties files mounted into the container filesystem.
- Failed health checks: A liveness probe timing out and killing a slow-starting application before initialization finishes.
- Resource constraints: Container memory exceeding its manifest limit, causing the kernel out-of-memory killer to terminate it (
Exit Code 137). - Permission problems: Non-root processes attempting to bind privileged ports or write to read-only directories.
- Missing dependencies: Startup scripts exiting immediately when a database or message broker is temporarily unreachable.
- Incorrect secrets: Missing or invalid credentials causing authentication failures at startup.
- Application crashes: Native segmentation faults or fatal runtime panics under initial traffic.
A methodical Kubernetes CrashLoopBackOff troubleshooting sequence isolates the root cause quickly:
- Confirm pod state and restart count: Run
kubectl get pods -n <namespace>to identify affected pods and check how quickly restarts are climbing. - Inspect pod events and exit codes: Run
kubectl describe pod <pod-name> -n <namespace>. CheckLast State(ReasonandExit Code—for example,1indicates an application error while137indicatesOOMKilled) and read theEventssection at the bottom. - Examine current container logs: Run
kubectl logs <pod-name> -n <namespace>(adding-c <container-name>for multi-container pods) to view current standard output and error streams. - Pull logs from the crashed container: Because active containers often restart before you inspect them, run
kubectl logs <pod-name> --previous -n <namespace>to read the exact stack trace recorded right before the last termination. - Check recent namespace events: Run
kubectl get events -n <namespace> --sort-by='.lastTimestamp'to catch failed volume mounts, missing config maps, or node resource pressure. - Verify deployment specifications: Run
kubectl get deployment <deployment-name> -n <namespace> -o yamlto review image tags, environment variable references, memory limits, and liveness or startup probe timings.
The right fix depends directly on what those logs and exit codes show—whether raising memory limits for an out-of-memory kill, fixing a missing secret key, or adding a startup probe to protect a slow-booting service.
How Engineering Operations Assessments Turn Findings into Improvement Roadmaps
Completing an operational review is only half the work. Many engineering teams finish an assessment, generate a long spreadsheet of gaps, and then watch that list stall while feature deadlines take over.
Turning assessment findings into real operational progress requires a ten-step execution cycle:
- Evaluate existing engineering capabilities: Score current practices consistently across teams and critical services.
- Collect assessment responses and evidence: Support practitioner answers with concrete artifacts like pipeline configs, SLO definitions, and postmortem records.
- Identify operational gaps: Pinpoint missing safeguards, manual bottlenecks, and unowned risks.
- Understand risks and dependencies: Separate urgent outage risks from longer-term optimizations, and map technical prerequisites—like setting up centralized logging before building log-driven alerts.
- Review maturity levels: Compare current scores against realistic target maturity levels aligned with each service’s criticality.
- Prioritize improvement opportunities: Rank fixes by risk reduction, engineering effort, and downstream impact.
- Define practical actions: Break broad recommendations into scoped, sprint-sized engineering tasks with clear completion criteria.
- Assign responsibilities: Give every roadmap item a single accountable team or technical owner.
- Track progress: Fold operational improvements into regular sprint planning rather than leaving them as spare-time chores.
- Reassess operational maturity: Re-run evaluations periodically to confirm that completed work measurably reduced risk and improved delivery.
OpsRoadmaps builds this progression directly into its workflow—linking diagnostic findings to dependency-aware improvement plans so teams tackle foundational prerequisites in sequence rather than launching disconnected cleanup projects.
Understanding Maturity Scoring and Explainable Assessments
Engineers rightfully question black-box maturity scores. When a tool hands a team a vague rating without showing the rules or evidence behind it, conversations quickly shift from fixing operational gaps to debating whether the number is accurate.
Credible, explainable assessments rely on nine core practices:
- Published scoring rules: Transparent criteria spelling out exactly what behaviors define each maturity level.
- Versioned assessment methodologies: Clear version tracking so teams can compare results accurately across quarters even as frameworks evolve.
- Capability-based evaluation: Measuring concrete operational habits rather than subjective impressions.
- Maturity levels: Distinct stages separating ad hoc firefighting from standardized, automated operations.
- Risk identification: Highlighting severe single-point failures prominently instead of burying them inside an average score.
- Prioritized findings: Ordering gaps by operational risk and technical dependency order.
- Evidence and supporting context: Linking assessment answers to actual configurations, dashboards, or runbooks.
- Repeatable assessments: Consistent rubrics that let leaders compare practices fairly across different teams.
- Progress tracking: Side-by-side score histories demonstrating that roadmap execution improved capabilities.
Internal self-assessments and formal external audits serve distinct roles and should never be conflated. A self-assessment captures internal team knowledge and operational evidence to guide engineering priorities, whereas an external audit provides independent third-party verification against formal regulatory standards.
OpsRoadmaps uses deterministic, explainable scoring backed by published rules and source-backed technical recommendations. Teams can trace every score and prioritized finding directly back to the underlying inputs and engineering practices behind it.
Exploring the Nine Domains of Engineering Operations
Modern software operations rarely fit neatly inside a single job title. Keeping production systems healthy requires coordinating specialized disciplines that overlap from code commit through runtime governance.
OpsRoadmaps covers 42 engineering operations disciplines organized across nine connected domains, spanning both foundational and specialized operational practices:
- DevOps: Continuous integration, automated delivery pipelines, release engineering, and cross-functional delivery workflows.
- GitOps: Declarative infrastructure and application synchronization driven through version-controlled repositories.
- DevSecOps: Automated security scanning, software supply chain integrity, secrets management, and policy-as-code guardrails.
- Site Reliability Engineering (SRE): SLOs, error budgets, toil reduction, capacity modeling, and resilience testing.
- Observability Engineering: Standardized instrumentation, metrics, structured logging, distributed tracing, and SLO-based alerting.
- Incident Management: On-call rotations, incident command coordination, stakeholder communication, and blameless postmortems.
- Cloud Operations: Multi-zone infrastructure design, automated provisioning, network reliability, backups, and disaster recovery.
- Platform Engineering: Internal developer portals, self-service templates, golden paths, and developer experience metrics.
- Cost Management (FinOps): Cloud cost allocation, resource right-sizing, commitment management, and unit cost visibility.
- MLOps and LLMOps: Specialized operational practices for deploying, monitoring, evaluating, and governing machine learning and large language model systems in production.
Evaluating these practices together matters because weaknesses in one domain quickly undermine strengths in another. Doubling deployment speed with delivery automation without matching observability and incident response maturity often just means shipping outages faster.
Technical Knowledge Resources for Engineering Teams
Recognizing an observability gap or an unhardened cluster is only helpful if your team knows how to resolve it cleanly. Pairing assessment diagnostics with practical engineering documentation saves teams from piecing together scattered articles during critical projects.
A well-organized engineering knowledge library supports implementation with seven types of practical resources:
- Engineering improvement roadmaps: Phased adoption guides breaking complex initiatives—like SRE, platform engineering, or DevSecOps—into realistic milestones.
- Operational checklists: Pre-launch and production hardening lists that catch easily overlooked configuration gaps.
- Incident troubleshooting runbooks: Step-by-step diagnostic procedures for resolving urgent production issues, such as container restart loops.
- Architecture blueprints: Reference patterns for resilient multi-zone deployments, telemetry pipelines, and secure delivery workflows.
- Technology decision guides: Practical trade-off analyses helping architects select appropriate operational patterns for their scale.
- Software tools: Curated overviews of open-source and ecosystem tooling aligned with specific operational capabilities.
- Reusable templates: Ready-to-adapt starter files for postmortem reports, SLO definitions, readiness reviews, and incident playbooks.
Combining diagnostic assessments with targeted runbooks, checklists, and blueprints helps engineers move directly from spotting a weakness to shipping a proven fix.
How to Choose the Right Engineering Operations Assessment Platform
Not every assessment tool fits real engineering workflows. Before adopting a platform across your organization, evaluate it against twelve practical criteria:
- Assessment coverage: Does it span delivery, reliability, security, observability, cloud infrastructure, and cost management rather than focusing on a single niche?
- Clear scoring methodology: Are scoring rules open and logical enough that engineers trust the output?
- Explainable results: Can teams inspect exactly which inputs drove a maturity rating?
- Maturity evaluation: Does it separate foundational operational hygiene from advanced automation?
- Technical accuracy: Are questions, checklists, and runbooks written with genuine practitioner depth?
- Source-backed recommendations: Do remediation steps reflect established engineering practices rather than generic filler?
- Improvement prioritization: Are findings ranked by operational risk and prerequisite order?
- Roadmap usability: Can teams turn results straight into sequenced sprint work?
- Assessment versioning: Are scoring models versioned so historical comparisons stay valid over time?
- Progress tracking: Can teams re-run assessments to verify that improvements actually landed?
- Practical knowledge resources: Does the platform include usable runbooks, templates, and checklists alongside scoring?
- Security and data handling: Does it protect sensitive operational inputs and let teams explore initial scans without unnecessary friction?
Choosing a platform built around transparency and usability ensures assessments become a practical engineering habit rather than another administrative chore.
Common Challenges in Improving Engineering Operations
Even motivated engineering teams encounter predictable obstacles when trying to raise operational maturity. Spotting these friction points early makes it easier to keep improvements moving:
- Unclear improvement priorities: Teams feel paralyzed by dozens of competing gaps. How to handle it: Rank findings by outage risk and tackle foundational prerequisites first.
- Legacy infrastructure: Older monoliths and manually configured servers resist modern automation. How to handle it: Wrap legacy systems with solid monitoring and tested backups first, then modernize incrementally.
- Limited engineering resources: Product feature pressure constantly pushes operational work out of sprints. How to handle it: Reserve a consistent percentage of sprint capacity—or enforce error-budget policies—for reliability and automation tasks.
- Skill gaps: Engineers lack hands-on familiarity with cluster hardening, distributed tracing, or SLO design. How to handle it: Provide clear architecture blueprints, starter templates, and phased roadmaps.
- Inconsistent processes: Every squad invents its own deployment scripts, alert rules, and incident habits. How to handle it: Establish shared baseline standards backed by self-service templates.
- Tool fragmentation: Overlapping monitoring and build tools split context and inflate maintenance overhead. How to handle it: Standardize telemetry formats and consolidate around shared core workflows.
- Poor observability: Teams struggle to debug incidents because logs, metrics, and traces live in disconnected silos. How to handle it: Prioritize structured logging, golden-signal dashboards, and trace propagation early.
- Security weaknesses: Manual pre-release security reviews slow launches and miss daily code changes. How to handle it: Automate secret, dependency, and infrastructure-as-code scanning directly inside pull requests.
- Cloud cost visibility: Developers launch resources without seeing the financial impact until month-end. How to handle it: Enforce resource tagging and route service-level cost dashboards directly to owning teams.
- Resistance to organizational change: Engineers push back against new processes that feel like bureaucracy. How to handle it: Build golden paths that make the secure, reliable choice the fastest choice.
- Unclear ownership: Shared databases or internal services lack a clear on-call owner during outages. How to handle it: Maintain an up-to-date service catalog assigning explicit ownership to every production component.
- Difficulty measuring progress: Leaders struggle to prove that operational investments are paying off. How to handle it: Track concrete metrics—change failure rate, recovery time, SLO attainment, and periodic maturity scores.
How OpsRoadmaps Supports Engineering Operations Improvement
OpsRoadmaps brings structured assessments, technical documentation, and improvement planning into one workspace built for engineering teams and technical leaders.
Its core capabilities include:
- Structured engineering operations assessments: Evaluations covering production readiness, delivery maturity, reliability, security, observability, incident management, platform engineering, cloud operations, and cost management.
- Free operational health scan: Visitors can run an initial operational health scan without creating an account to get a quick read on baseline practices.
- Deeper assessments for signed-in users: Registered users unlock comprehensive production readiness and reliability assessments across teams and services.
- Published and versioned scoring rules: Documented criteria that keep maturity scoring transparent and comparable across assessment versions.
- Explainable maturity scoring: Clear breakdowns tying maturity scores directly to specific operational inputs and supporting evidence.
- Prioritized findings and source-backed recommendations: Risk-ordered gaps paired with technically grounded remediation guidance.
- Dependency-aware improvement plans: Sequenced roadmaps that place foundational prerequisites ahead of advanced optimizations.
- Practical technical knowledge library: Actionable roadmaps, operational checklists, troubleshooting runbooks, architecture blueprints, technology decision guides, and reusable templates.
A team might start by opening a Kubernetes readiness checklist or troubleshooting runbook, running a free operational health scan to spot immediate blind spots, and using the prioritized findings to shape their next quarter’s engineering roadmap.
Like any internal assessment tool, OpsRoadmaps supports better-informed engineering decisions; it does not replace independent third-party audits, formal regulatory certifications, or the hands-on engineering work required to keep production systems reliable.
Frequently Asked Questions About Engineering Operations and OpsRoadmaps
What is a production readiness assessment?
A production readiness assessment is a pre-launch engineering review that verifies whether a service and its underlying infrastructure are prepared for live user traffic and failure scenarios. It checks reliability patterns, security controls, monitoring, tested backups, rollback procedures, and capacity headroom before users depend on the system.
How does a DevOps maturity assessment help engineering teams?
A DevOps maturity assessment evaluates how reliably and efficiently code moves from commit to production across delivery pipelines, infrastructure as code, automated testing, and release workflows. It pinpoints specific delivery bottlenecks so teams can focus automation work where it cuts lead time and deployment risk most.
What should a Kubernetes production readiness checklist include?
A solid Kubernetes production readiness checklist verifies multi-zone cluster architecture, explicit CPU and memory requests and limits, tuned readiness and liveness probes, container image vulnerability scanning, default-deny network policies, externalized secrets management, persistent volume backups, autoscaling rules, centralized telemetry, and pod disruption budgets.
What is a platform engineering adoption roadmap?
A platform engineering adoption roadmap is a phased plan for building an internal developer platform. It begins by researching developer workflow bottlenecks, standardizing common infrastructure tasks into reusable templates, offering self-service provisioning with built-in security guardrails, and tracking developer adoption over time.
How can organizations start an SRE adoption roadmap?
Teams can kick off an SRE adoption roadmap by selecting one or two critical services, instrumenting basic latency and error SLIs, and agreeing on realistic SLOs with product stakeholders. Establishing an error-budget policy, running blameless postmortems, and automating repetitive manual toil build momentum from there.
What is an incident management maturity model?
An incident management maturity model measures how effectively an organization detects, coordinates, resolves, and learns from production outages. It tracks progression across symptom-based alerting, clear severity tiers, escalation paths, healthy on-call rotations, structured incident command, and blameless post-incident reviews.
How does a DevSecOps implementation roadmap improve security practices?
A DevSecOps implementation roadmap weaves automated security checks directly into everyday coding and delivery pipelines. Rolling out secret scanning, dependency checks, static code analysis, container image scanning, and infrastructure-as-code policy checks incrementally catches vulnerabilities early without creating last-minute launch bottlenecks.
What is an observability maturity model?
An observability maturity model evaluates how well engineering teams collect, correlate, and analyze metrics, logs, and distributed traces to understand complex system behavior. It guides teams from basic host alerts toward standardized instrumentation, SLO-driven paging, and fast cross-service root-cause debugging.
How can organizations create a cloud cost optimization roadmap?
Building a cloud cost optimization roadmap starts with enforcing resource tags for spending visibility, identifying top cost drivers, and analyzing actual utilization metrics. From there, teams delete idle resources, right-size oversized instances, schedule non-production shutdowns, apply commitment discounts to steady baselines, and run recurring cost reviews.
How do you troubleshoot Kubernetes CrashLoopBackOff errors?
Start troubleshooting CrashLoopBackOff by running kubectl describe pod to check the container’s last exit code and recent pod events, then run kubectl logs --previous to inspect the crash stack trace from the terminated container. Common fixes include correcting startup commands, adding missing environment variables or secrets, raising memory limits for out-of-memory kills, or adjusting aggressive liveness probes.
Final Thoughts
Operational health holds up when everyday habits match the pressure of live traffic—clear ownership, verified fallbacks, honest postmortems, and steady attention to cost and security. A clear baseline turns vague worry about fragility into a concrete set of next steps.Using structured assessments alongside practical playbooks across delivery, reliability, platform engineering, security, observability, incident response, and cost management helps teams fix foundational gaps before they turn into outages, with OpsRoadmaps connecting those diagnostics and technical resources to actionable roadmaps.opsroadmaps.com
Leave a Reply